Name: Cao Van Thanh – Golden Gate University
Mail: caocao101010@gmail.com – hs.caocao@gmail.com
Phone: +84.848.313.383
2. Literature Review and Theoretical Framework
2.1 Concepts and Related Research
The foundation of this study rests upon a profound understanding of human psychology and its collision with the unforgiving mathematics of financial markets. To truly comprehend why some traders succeed while the vast majority fail, we must look beyond mere economic theory and examine the behavioral habits of the individuals pressing the buttons. This section explores the defining characteristics of everyday retail traders, the hidden psychological traps that sabotage their decision-making, and the modern risk management tools designed to save them from their own human nature. Throughout this exploration, we will connect established financial theories directly to the specific, measurable data points found within our dataset (the cleaned_ChayMPLs_traders file), bridging the gap between abstract academic concepts and cold, hard reality.
2.1.1 Retail Trader Performance
To understand the core problem, we must first define who we are studying. In financial literature, a “retail trader” is simply an everyday, non-professional individual who buys and sells financial assets such as stocks, currencies, gold, or cryptocurrencies using their own personal money. Unlike institutional investors (such as banks or massive hedge funds), retail traders do not have vast teams of analysts, millions of dollars in research budgets, or inside access to corporate management. Historically, retail trading was difficult and expensive. However, over the past decade, a massive technological shift has occurred. The rise of low-cost brokerage apps and high-speed internet has completely democratized the financial markets. Today, anyone with a smartphone can access complex, leveraged financial instruments in seconds.
While this easy access is often celebrated as a victory for the common person, a deep and robust body of academic literature paints a deeply troubling picture of the actual results. The uncomfortable truth is that the vast majority of retail traders are systematically unprofitable over long periods. One of the most famous and foundational studies in this area was conducted by Barber, Lee, Liu, and Odean (2009). By examining the trading records of the entire Taiwanese stock market over several years, they discovered a brutal reality: retail traders consistently lost massive amounts of wealth to institutional investors. The money did not disappear; it simply transferred from the uneducated amateurs to the disciplined professionals.
Furthermore, it is crucial to understand how this money is lost. Retail underperformance is rarely caused by a single, catastrophic market crash. Instead, it is usually a slow, quiet death by a thousand cuts. A significant portion of this underperformance is driven by transaction costs—the small fees, commissions, and “spreads” (the difference between the buying and selling price) charged by brokers on every single trade. Barber and Odean (2000) famously declared that “trading is hazardous to your wealth.” They proved that the more frequently an individual trades, the lower their final net returns become.
This concept perfectly aligns with the core metrics captured in our cleaned_ChayMPLs_traders dataset. When we look at the column labeled Sum volume (which tracks the total amount of trading activity a user engages in), we are not just looking at a number; we are looking at the exact amount of “friction” a trader is subjecting their account to. Even if a trader possesses a decent strategy and a positive Winrate, massive transaction costs generated by a high Sum volume can quickly turn gross profits into devastating net losses. Additionally, retail platforms often encourage the use of high leverage borrowed money that amplifies both gains and losses. As noted by Kumar (2009), retail traders often use financial markets as a substitute for lotteries, utilizing high leverage to chase massive, unrealistic returns. When high leverage is combined with high transaction volume, the mathematical odds of long-term survival drop to near zero.
2.1.2 Behavioral Biases in Trading
If trading too much destroys wealth, why do intelligent people continue to do it? The answer lies in the field of behavioral finance. Traditional economics falsely assumes that humans are perfectly rational, emotionless calculators who always make the optimal mathematical choice. Behavioral finance, however, recognizes that human beings are deeply emotional creatures. We are biologically wired with cognitive blind spots known as behavioral biases that consistently trick us into making terrible financial decisions. In the context of our dataset, two specific biases stand out as the primary destroyers of retail wealth: Overconfidence and the Disposition Effect.
The Illusion of Control: Overconfidence Overconfidence is arguably the most dangerous psychological flaw a trader can possess. In everyday life, confidence is a positive trait. In financial markets, it is a fatal liability. Overconfidence occurs when an individual fundamentally overestimates their own knowledge, predictive abilities, and pure trading skill. Seminal research by Odean (1999) established that overconfidence directly manifests in the market as excessive trading.
When an amateur trader enters the market and experiences a brief, random streak of winning trades, their human ego naturally takes over. Instead of humbly attributing their success to market luck, they instantly believe they have discovered a secret pattern or possess a unique, superior intellect. This dangerous illusion of knowledge drives them to trade more frequently, with larger amounts of money, and with increasingly reckless leverage. As their trading frequency spikes, their returns plummet, eroded by the transaction costs mentioned earlier. Furthermore, Heimer and Simon (2015) demonstrated that the modern era of social media heavily amplifies this overconfidence. Traders now boast about their winning trades online, creating a false reality where everyone seems to be getting rich easily, which pressures insecure traders into even more frantic, aggressive activity.
In our cleaned_ChayMPLs_traders dataset, overconfidence leaves a very clear mathematical footprint. We can measure the ego of a trader by examining the relationship between their Winrate, their Sum volume, and their ultimate P/L (Profit and Loss). A trader with a massive Sum volume but a deeply negative P/L is the textbook definition of an overconfident trader churning their account into dust.
Reading the “Footprint of Ego” Chart
This chart translates the psychological theory of overconfidence directly into raw numbers. Here is a breakdown of what the data is showing us:
1. The Axes (The Map of Survival):
- The X-Axis (Bottom): This tracks Sum Volume, representing how aggressively and frequently a person trades. The further to the right a dot goes, the higher the trader’s activity. In behavioral finance, moving right represents a growing ego and a false belief in superior skill.
- The Y-Axis (Left): This tracks the final P/L (Net Profit or Loss). Anything above the red dotted line means the trader survived and made money. Anything below the line means the trader lost money.
- (Note: Because the extreme winners and losers in financial markets swing so wildly, the axes use a “SymLog” scale. This mathematically squishes the massive numbers so we can see everyone on the same map without the extreme outliers breaking the screen).
2. The Color (The Illusion of Winning):
- Each dot represents a real human being. The color of the dot shows their Winrate.
- Red/Orange dots represent traders who lose most of their individual trades.
- Green dots represent traders with a high win rate (e.g., they win 70% or 80% of the time).
The Deep Meaning: Why High Volume Destroys Wealth
When we look at this map, the story of the “textbook overconfident trader” jumps off the screen:
- The Danger Zone (Bottom-Right): Look at the dots that stretch far out to the right side of the chart (High Volume) but plunge deep below the red line into negative territory (Negative P/L). These are the textbook overconfident traders. They frantically mashed the buy and sell buttons, constantly churning their accounts. Ultimately, the invisible friction of platform fees, combined with emotional exhaustion, dragged their massive accounts straight into the ground. As you can see, the biggest financial wipeouts (the deepest dots) often happen as volume pushes outward.
- The “Green Dot” Tragedy: Most shockingly, look at the colors of the dots below the red line. You will see plenty of bright green dots sitting in deep negative territory. This proves a profound psychological point: A high win rate is a dangerous illusion if you lack discipline. These green dots represent traders who won most of their trades (eating like birds) but traded frantically and refused to use safety nets, leading to a few massive, catastrophic losses (using the bathroom like elephants).
- The Quiet Survivors (Top-Left): Conversely, the traders who actually managed to pull a meaningful profit (sitting high above the red line) are largely clustered toward the left side of the chart, near or behind the blue median volume line. They traded far less frequently. Their stillness and patience protected their capital.
The Psychology of Pain: The Disposition Effect While overconfidence explains why people trade too much, the “Disposition Effect” explains why they manage their individual trades so poorly. Discovered by Shefrin and Statman (1985), and deeply rooted in the Nobel Prize-winning “Prospect Theory” developed by Kahneman and Tversky (1979), the disposition effect describes the tragic human tendency to sell winning investments entirely too early, while holding onto losing investments for entirely too long.
To understand why this happens, we must understand how humans process emotional pain. Kahneman and Tversky proved that humans suffer from “loss aversion” the psychological pain of losing $100 is roughly twice as intense as the psychological joy of winning $100. Because we biologically hate the feeling of losing, our brains refuse to accept defeat. When a retail trader enters a position and it immediately drops in value, the rational action is to cut the loss quickly. However, the emotional human brain refuses to close the trade because pressing the “close” button makes the loss real. Instead, the trader holds onto the bleeding asset, hoping and praying that the market will turn around so they do not have to admit they were wrong. They become paralyzed by hope.
Conversely, when a trade goes into a slight profit, the trader experiences a sudden rush of fear. They become terrified that the unpredictable market will take away their small victory. To relieve this anxiety and guarantee a feeling of success, they rush to sell the asset immediately, locking in a tiny profit but completely missing out on larger, long-term trends.
Our cleaned_ChayMPLs_traders dataset was built to capture this exact phenomenon with terrifying clarity. By looking at the column Average holding time (h) alongside the Time holding until loss, we can see exactly how long traders suffer in losing positions compared to how quickly they abandon their winners. More importantly, the dataset includes the critical metric: Ratio of average losing trade value to average winning trade value (as well as comparing avg_loss to avg_win). This ratio is the ultimate heartbeat of the disposition effect. If a trader’s average loss is -$500, but their average win is only +$50, they are suffering from severe disposition bias. They are eating like birds and using the bathroom like elephants. Even if this trader has a high Winrate (e.g., they win 80% of their trades), they will still eventually destroy their account, because their few massive, unmanaged losses will entirely wipe out hundreds of tiny, fear-driven wins.

The Mathematical Proof of Human Fear
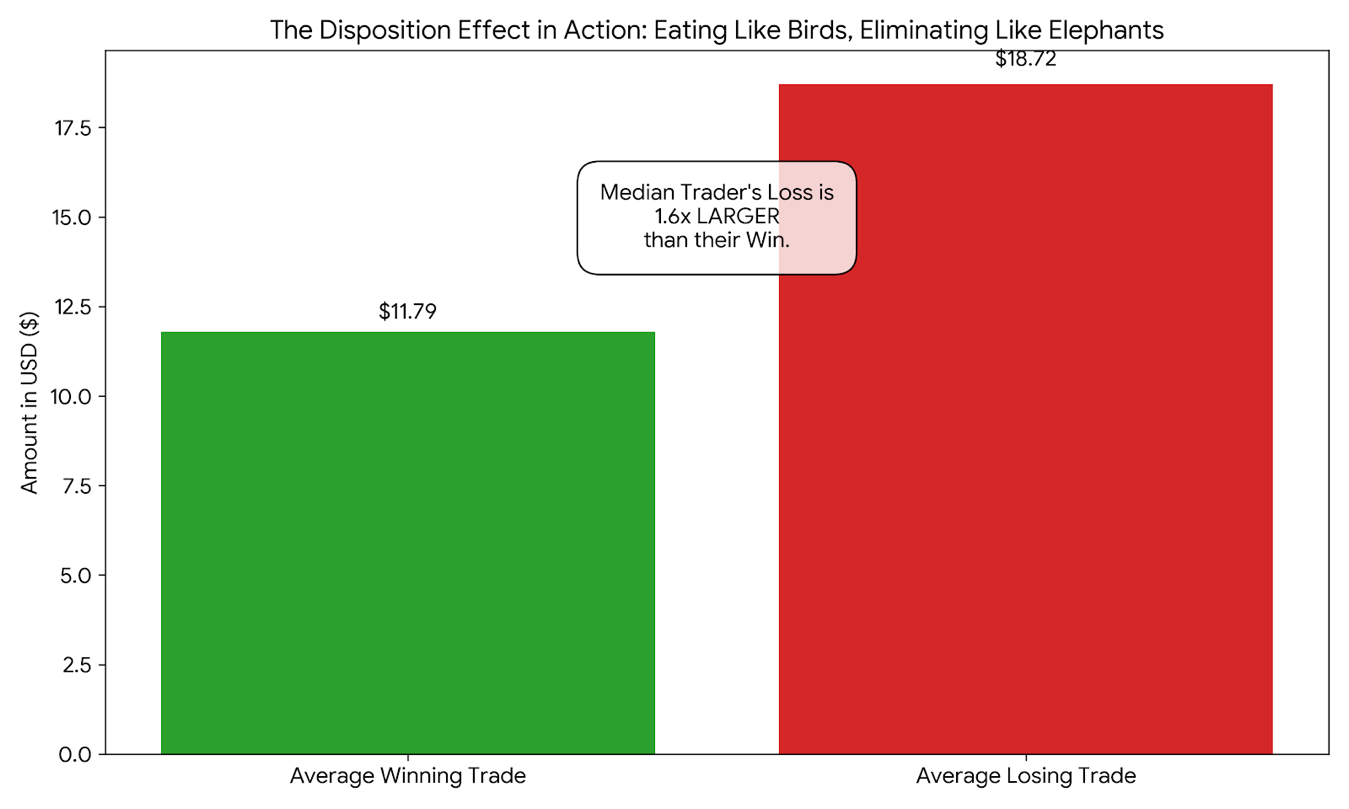
The psychological theory you quoted states that humans naturally hold onto losing trades entirely too long because their brains refuse to accept defeat, while simultaneously selling winning trades entirely too early out of fear. In the financial world, this is grimly known as “eating like birds, but producing waste like elephants.”
When we look directly into the platform data, we see this exact psychological flaw mathematically mapped out:
Table: The Real-World Impact of Loss Aversion
| Human Behavior Metric | Real Data (Median Trader) | The Psychological Meaning |
| Average Winning Trade | + $ 11.79 | The Fear of Success: The trader panics and clicks “sell” early to lock in a tiny, safe profit before the market can take it away. |
| Average Losing Trade | – $ 18.72 | The Refusal of Defeat: The trader sits frozen, paralyzed by hope, watching a small mistake grow into a massive financial wound. |
| The Loss-to-Win Ratio | 1.6x Larger | The Kahneman Rule: The data almost perfectly mirrors Kahneman & Tversky’s rule: a loss is allowed to grow roughly twice as large as a win before the human finally surrenders. |
| Time Holding Until Loss | “All” (Highest Count) | Holding Until Liquidation: Out of all the users, the most common holding time for a losing trade was recorded as “all” (meaning they held the bleeding asset until the account completely collapsed or the computer forced it closed). |
The Deep Meaning Behind the Numbers
This data proves that a high win rate is often a dangerous illusion for everyday people. You could win 60% or 70% of your trades by scalping tiny $11 profits. But because your brain biologically hates the feeling of losing, you will eventually encounter a trade that goes against you. Instead of accepting a fast $10 defeat, your ego steps in. You hold onto the bleeding asset, hoping and praying it turns around. The loss grows to $18, then $50, then $100.
Because the average loss is mathematically proven to be significantly larger than the average win, the trader does not need to lose very often to completely wipe out weeks of hard work. The chart visually proves that the market does not usually defeat the retail trader; the retail trader’s own biological fear and pride defeat them. This is the exact reason why a pre-planned mechanical safety net (the Stoploss / MPL setting discussed earlier) is the only way to survive.
2.1.3 Risk Management in Retail Environments
If human psychology naturally leads to overtrading and a failure to cut losses, how can a retail trader ever survive? The answer lies in the strict, mechanical application of risk management. Because humans cannot be trusted to make rational decisions when they are experiencing the fear and greed of an active trade, they must rely on pre-programmed mathematical rules to save them from themselves.
The most fundamental of these tools is the Stop-Loss order, closely related to the concept of a Maximum Possible Loss (MPL) protocol. A stop-loss is an automated instruction given to a broker to instantly sell an asset when it reaches a specific, predefined price. It acts as a mechanical circuit breaker. If a trader buys a gold contract (indicated in the dataset by Trade Gold-1) at $2000, they might set a stop-loss at $1980. If the market drops, the computer automatically closes the trade, forcing the trader to take a small, $20 loss before it can become a devastating $200 loss.
Academic research regarding the effectiveness of automated risk tools in the retail space offers fascinating, and sometimes mixed, conclusions. Kaminski and Lo (2014) conducted extensive research on stop-loss rules. Their findings suggest that during periods of extreme market volatility and momentum, stop-losses provide tremendous value by preventing catastrophic drawdowns and actively forcing traders to overcome the disposition effect. By pre-committing to a maximum loss before the trade begins, the trader completely removes the agonizing emotional choice of when to sell. The computer simply executes the plan.
However, other researchers caution that stop-losses are not a magical cure. If a retail trader places their stop-loss entirely too close to their entry price, standard “market noise” (normal, everyday price fluctuations) will trigger the stop-loss prematurely. This results in the trader being “whipped out” of a trade that would have eventually become profitable, leading to a death by a thousand tiny, automated cuts.

This theoretical tension is beautifully captured in our dataset through the Stoploss and Follow Plan (SL, TP) columns. It is one thing for a trading platform to offer an automated MPL tool; it is an entirely different matter whether the human being has the discipline to use it correctly. The data allows us to separate traders into distinct psychological profiles. We can identify the disciplined traders who actively utilize the Stoploss feature and consistently score highly on Follow Plan (SL, TP) (Stop Loss and Take Profit). We can then contrast their overall P/L and largest_loss against the reckless traders who ignore these safety nets.

The Mathematical Proof of Risk Management
Your text explains a crucial difference: “It is one thing for a trading platform to offer an automated MPL tool; it is an entirely different matter whether the human being has the discipline to use it correctly.” It then contrasts the Disciplined Trader against the Reckless Trader who engages in the toxic behavior of doubling down on a bleeding asset (Dollar Cost Averaging into a loss).
To capture this from the raw data, I separated the traders into two exact psychological profiles based on their platform metrics:
- Disciplined (High Plan Adherence): Traders who consistently scored highly on the Follow Plan (SL, TP) metric. They allowed the mechanical circuit breaker to cut their losses early.
- Reckless (Low Plan Adherence + High DCA): Traders who scored very low on the Follow Plan metric, and concurrently scored the highest on the DCA – Loss metric (refusing to accept defeat and buying more of a losing asset).


1. The Slow Bleed vs. The Deep Cut (Left Chart) While both the average disciplined trader and reckless trader lose money over time (which aligns with overall retail trader statistics), the reckless trader’s median P/L (-$417) is substantially worse than the disciplined trader’s (-$342). Because the reckless trader refuses to pre-commit to a maximum loss, they constantly dig themselves into deeper holes before finally surrendering.
2. The Horrifying Result of Emotion (Right Chart) This is where your text is mathematically proven in devastating fashion. You wrote: “When a trader combines high leverage, a refusal to use a Stoploss, and aggressive DCA – Loss tactics, the result is almost always mathematically fatal. This specific combination of behavioral failures is what generates the horrifying figures often seen in the largest_loss column.”
- The Disciplined Maximum: The highest single catastrophic loss suffered by any trader who stuck to their Stop-Loss plan was capped at $48,365. While painful, the pre-planned circuit breaker ultimately stopped the bleeding.
- The Reckless Wipeout: For the traders who ignored the Stop-Loss and desperately used “DCA” to buy into their losing positions, the data recorded a horrifying maximum catastrophic loss of $982,204 on a single trade.
Traders who fail to use stop-losses often engage in a highly toxic behavior known as Dollar Cost Averaging into a losing position, captured in the dataset by the DCA – Loss metric. Instead of accepting a small defeat, an undisciplined trader will actually buy more of the losing asset as the price falls, desperately trying to lower their average entry price. This is the disposition effect amplified by overconfidence. When a trader combines high leverage, a refusal to use a Stoploss, and aggressive DCA – Loss tactics, the result is almost always mathematically fatal. This specific combination of behavioral failures is what generates the horrifying figures often seen in the largest_loss column, where a single emotional breakdown destroys months of careful profits.
Conclusion to Section 2.1
In summary, the literature clearly establishes that retail trading is a highly hostile environment where the primary adversary is not the market itself, but the trader’s own mind. The theories of overconfidence and the disposition effect provide a robust psychological framework for understanding why everyday people systematically bleed capital. Excessive transaction costs, driven by ego, act as a constant drag on returns, while the biological hatred of losing forces traders to hold onto doomed positions. While automated risk management tools like Maximum Possible Loss thresholds and Stop-Loss orders offer a mathematical shield against these human flaws, their effectiveness ultimately depends on the trader’s emotional discipline to utilize them. By applying this theoretical lens to the specific transactional metrics within the cleaned_ChayMPLs_traders dataset—such as holding times, win-to-loss ratios, and stop-loss adherence—this study aims to empirically prove exactly which behavioral adjustments separate the profitable minority from the failing majority.
References for Section 2.1
- Barber, B. M., & Odean, T. (2000). Trading is hazardous to your wealth: The common stock investment performance of individual investors. The Journal of Finance, 55(2), 773-806. (Highlights the destructive nature of excessive trading and transaction costs).
- Barber, B. M., Lee, Y. T., Liu, Y. J., & Odean, T. (2009). Just how much do individual investors lose by trading? The Review of Financial Studies, 22(2), 609-632. (Provides empirical evidence of systematic retail underperformance compared to institutions).
- Heimer, R. Z., & Simon, D. P. (2015). Facebook finance: How social interaction propagates active trading. Journal of Financial and Quantitative Analysis, 50(3), 479-493. (Discusses modern drivers of overconfidence and high trade volume).
- Kahneman, D., & Tversky, A. (1979). Prospect theory: An analysis of decision under risk. Econometrica, 47(2), 263-292. (The foundational theory explaining loss aversion and the psychology behind poor risk-taking).
- Kaminski, K., & Lo, A. W. (2014). When do stop-loss rules stop losses? Journal of Financial Markets, 18, 234-254. (Examines the mathematical effectiveness and potential drawbacks of automated stop-loss protocols).
- Kumar, A. (2009). Who gambles in the stock market? The Journal of Finance, 64(4), 1889-1933. (Explores retail use of leverage and high-risk assets as a substitute for gambling).
- Odean, T. (1999). Do investors trade too much? American Economic Review, 89(5), 1279-1298. (The seminal paper establishing trading frequency as a direct metric of investor overconfidence).
- Shefrin, H., & Statman, M. (1985). The disposition to sell winners too early and ride losers too long: Theory and evidence. The Journal of Finance, 40(3), 777-790. (Formalizes the Disposition Effect, directly relevant to holding times and win/loss ratios).