Trader Sentiment Analysis
Date: 16 December 2025
Asset Focus: Gold Spot (XAU/USD)
Timeframe: Daily (D1)
Market Context: Late-cycle uncertainty, pre-US labor data
Source Chart: TradingView – Pepperstone

1. Macro-Financial Environment and Cross-Asset Sentiment
The final full trading week of 2025 opened under conditions of elevated macro uncertainty, characterized by mixed performance across equities, fixed income, currencies, and digital assets. Market participants exhibited restrained positioning as attention shifted toward imminent U.S. labor market data, which is expected to play a decisive role in shaping the Federal Reserve’s forward rate guidance.
Equity markets reflected a moderate risk-off tone. The S&P 500 closed marginally lower, below the 6,820 threshold, signaling exhaustion after a prolonged rally. Technology stocks were a notable source of weakness, with Broadcom experiencing its worst three-day decline since 2020 and Oracle extending a multi-session selloff approaching 17%. These developments underscore increasing investor sensitivity to valuation risk within high-beta growth sectors.
In fixed income markets, short-term Treasury yields declined, particularly at the two-year tenor, as futures markets priced in two Federal Reserve rate cuts in 2026 to mitigate potential labor market softening. This occurred despite persistent inflationary pressures, reflecting a growing belief that monetary policy may be excessively restrictive. The 10-year Treasury yield remained stable near 4.18%, indicating that long-term inflation expectations have not materially deteriorated.
The U.S. dollar index traded near its lowest level since October, while cryptocurrency markets weakened sharply, with Bitcoin falling below USD 86,000, reinforcing a defensive investor posture. Concurrently, the Japanese yen strengthened amid speculation that the Bank of Japan may raise interest rates, contributing to broader currency realignment and further weighing on the dollar.
Within this macro framework, gold emerged as a relative beneficiary of policy uncertainty, declining real yields, and risk aversion, positioning it as a focal asset for sentiment analysis on 16/12/2025.
2. Technical Interpretation of the Gold (XAU/USD) Daily Chart

2.1 Structural Overview
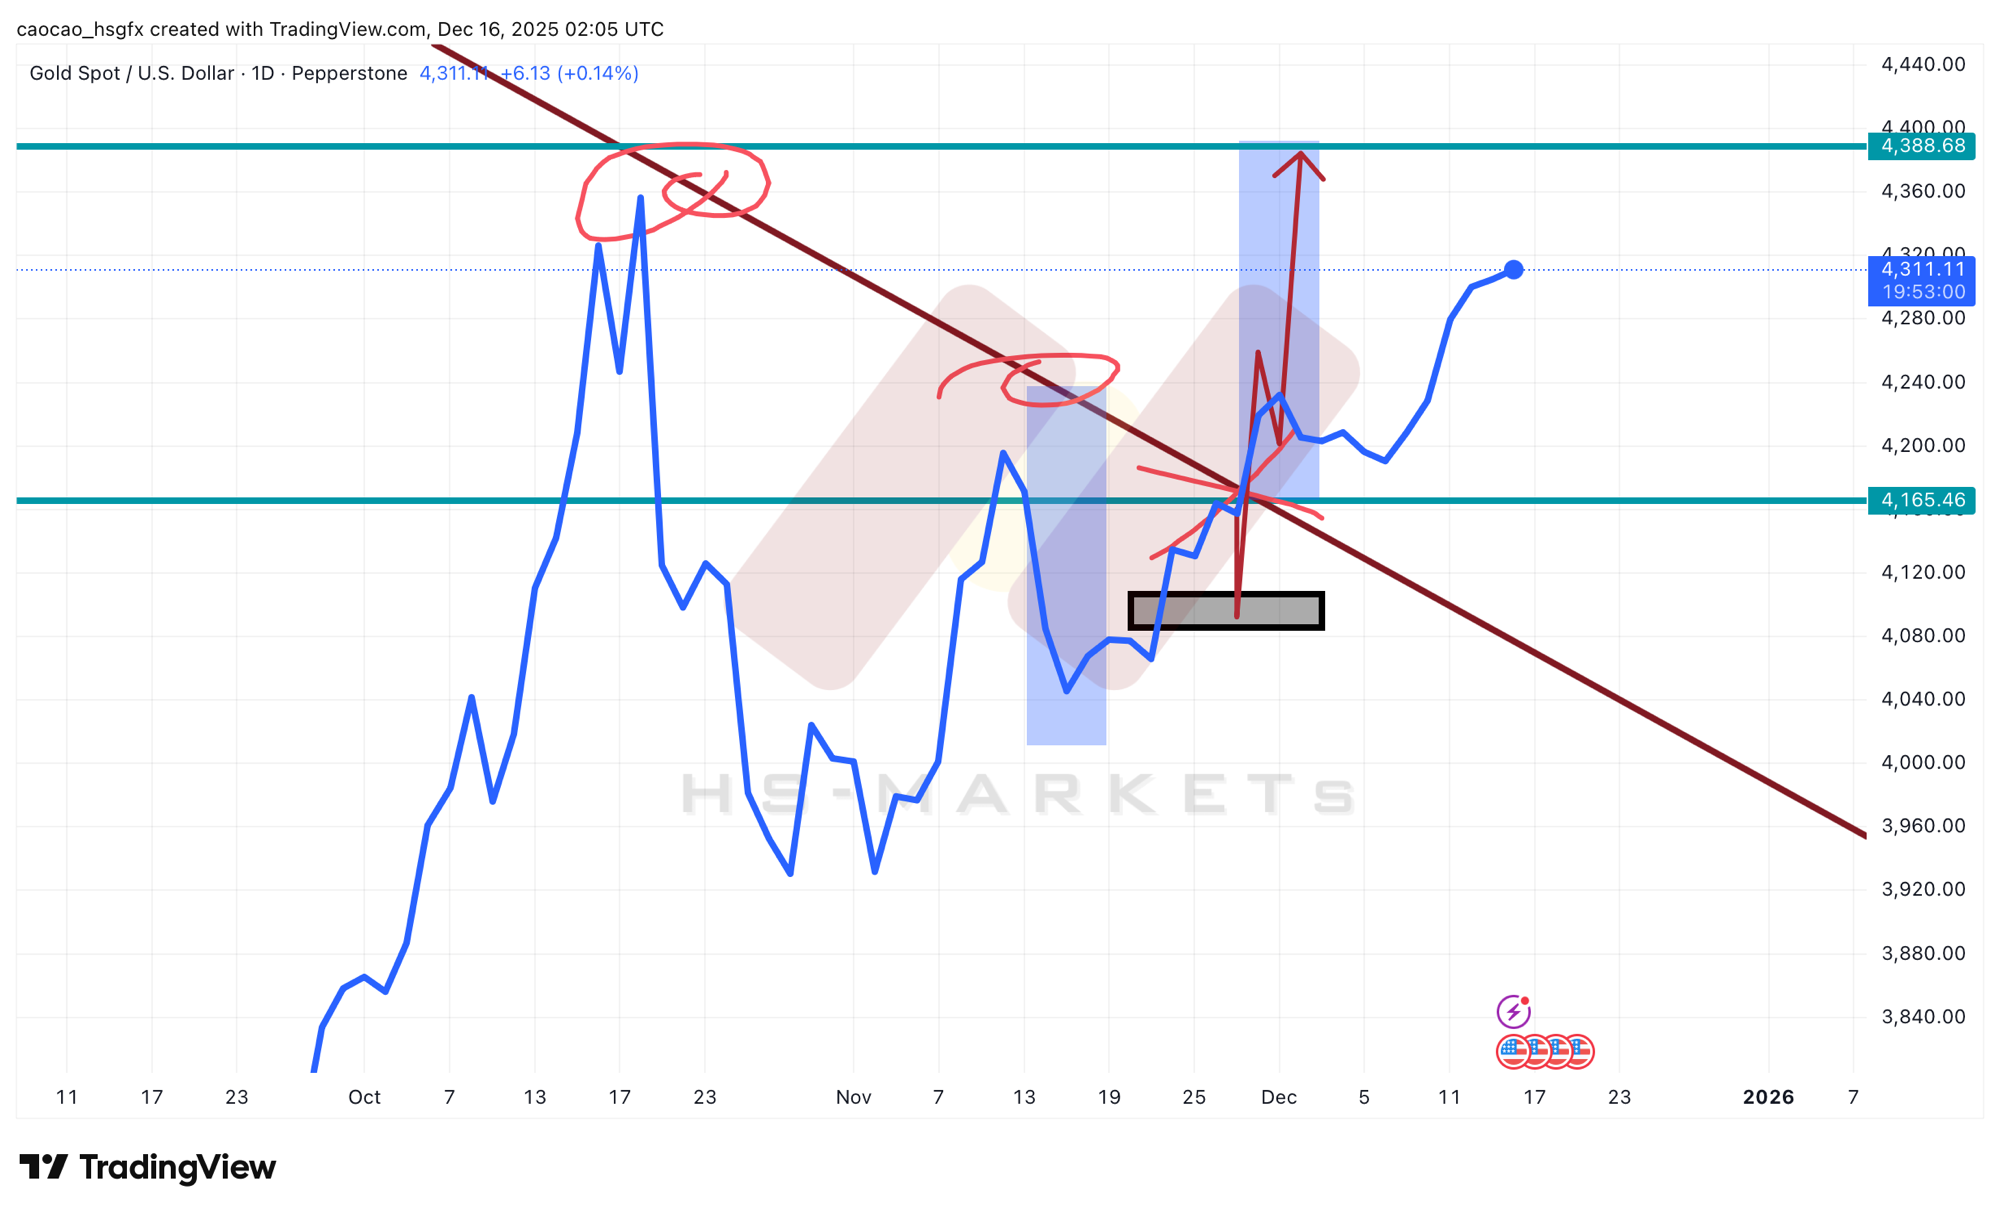
The attached daily chart of Gold Spot / U.S. Dollar (XAU/USD) reveals a medium-term bullish recovery embedded within a broader corrective channel. Price action throughout Q4 2025 demonstrates a sequence of higher lows following a sharp October drawdown, indicating that downside momentum has weakened substantially.
A prominent descending trendline, drawn from the September high, had previously acted as dynamic resistance. The chart clearly illustrates multiple failed breakout attempts along this trendline (highlighted by rejection zones), suggesting that sellers initially retained structural control. However, the most recent price action shows a decisive bullish response from a demand zone near 4,080–4,120, followed by a strong impulsive move higher.
This behavior marks a technical transition from compression to expansion, often associated with institutional re-engagement.
2.2 Key Price Levels and Market Memory
The chart identifies two critical horizontal levels that are central to trader sentiment:
Major Resistance: ~4,388 This level aligns with prior swing highs and represents a psychologically significant barrier. Repeated historical reactions indicate the presence of large resting sell orders or profit-taking behavior. Major Support: ~4,165 This zone corresponds with a prior consolidation area and the origin of the most recent impulsive bullish leg. It represents a high-probability demand zone, reinforced by volume expansion and long-wick rejection candles.
Current price action near 4,306 suggests that gold is trading above value but below supply, a condition typically associated with trend continuation preparation rather than distribution.
2.3 Candlestick and Momentum Signals
The most recent candles show:
Strong bullish bodies with limited upper wicks, indicating acceptance of higher prices. A successful reclaim of prior resistance, now acting as support (role reversal). Absence of bearish engulfing or exhaustion patterns.
Momentum indicators (inferred from price behavior):
Relative Strength remains constructive, not overextended. Volatility expansion following a prolonged contraction phase supports directional follow-through.
Collectively, the technical evidence favors a bullish continuation bias, conditional on macro validation.
3. Gold Sentiment Analysis on 16/12/2025
3.1 Institutional vs Retail Positioning
From a sentiment perspective, gold trading on 16/12/2025 reflects institutional accumulation rather than retail speculation. The impulsive breakout from the demand zone occurred with limited retracement, a characteristic typically associated with professional order flow rather than retail-driven momentum chasing.
Retail traders, by contrast, appear cautious, likely influenced by:
Mixed Federal Reserve communication. Imminent U.S. labor data risk. Recent volatility in equities and crypto markets.
This divergence suggests that smart money is positioning ahead of confirmation, while weaker hands remain reactive.
3.2 Behavioral Finance Interpretation
Under behavioral finance theory, the current gold setup aligns with a “late skepticism” phase, where prices rise despite widespread uncertainty. Traders remain anchored to prior resistance failures, underestimating the significance of structural improvement and macro tailwinds such as falling real yields and dollar weakness.
This psychological mismatch often precedes trend acceleration, particularly if upcoming macro data validates the prevailing narrative of policy easing.
4. Trading Implications and Strategic Guidance
4.1 Directional Bias
Based on combined macro, technical, and sentiment factors, the dominant bias for gold on 16/12/2025 is cautiously bullish.
This bias is supported by:
Declining short-term yields. Weakening U.S. dollar. Risk aversion in equities and crypto. Bullish technical structure above key support.

However, the proximity to major resistance necessitates disciplined execution.
4.2 Practical Trading Advice
For Day Traders:
Favor buy-on-pullback strategies toward the 4,165–4,200 zone. Avoid initiating new shorts unless price decisively rejects the 4,388 resistance with volume. Reduce position size ahead of U.S. labor data releases.
For Swing Traders:
Maintain long exposure while price remains above structural support. Partial profit-taking near resistance is justified. A confirmed daily close above 4,388 would signal trend continuation toward new highs.
For Risk Management:
Avoid over-leverage in pre-data environments. Use volatility-adjusted stops rather than fixed pip distances. Treat false breakouts as information, not failure.
5. Conclusion
On 16 December 2025, gold stands at a critical inflection point, reflecting macro uncertainty, evolving Federal Reserve expectations, and improving technical structure. The attached chart confirms that price has transitioned from corrective behavior to controlled bullish expansion, supported by institutional demand and declining opportunity costs.
Trader sentiment is best described as constructively cautious: optimism is present, but conviction remains data-dependent. In such an environment, disciplined execution, respect for key levels, and patience are essential.
From an academic and practical standpoint, gold on this date exemplifies how macro-financial ambiguity often strengthens the appeal of real assets, reinforcing gold’s role as both a tactical trading instrument and a strategic hedge in late-cycle market conditions.